Agrometeorology Cell

Man Power
|
Sr.No
|
Name & Designation
|
Budget Head
|
Name of Scheme
|
|
1
|
Prof. D. R. Vaghasiya,
Assistant Professor
|
3126-1
|
G-1, Teaching
|
|
2
|
Shri H. H. Katara, Agril. Asstt.
|
6119
|
IF |
|
3
|
Dr. J. B. Gajera, Research Associate
|
18005-1
|
Gramin Krishi Mausam Sewa (GKMS) |
|
4
|
Shri U.B. Parmar, Agro Met Observer
|
18005-1
|
Gramin Krishi Mausam Sewa (GKMS) |
(A) TEACHING ACTIVITIES
|
S.N
|
Course No.
|
Name of Course
|
Credit
|
|
UG Courses (5th Deans)
|
|||
|
1
|
Ag. Met. 1.1
|
Intro. Agricultural Meteorology & Climate Change
|
1+1
|
|
2
|
NRMH 2.4
|
Agricultural Meteorology & Climate Change
|
1+1
|
|
3
|
ENVS 5.1
|
Environmental Studies and Disaster Management
|
2+1
|
|
4
|
NRMH 6.11
|
Environmental Studies and Disaster Management
|
2+1
|
| UG Courses (6th Deans) | |||
| 1 | VAC-I | Environmental Studies and Disaster Management | 2+1 |
|
PG Courses (ICAR BSMA Syllabus)
|
|||
|
1
|
AGM-501
|
RS and GIS Applications in Agricultural Meteorology
|
2+1
|
|
2
|
AGM-502
|
Fundamentals of Agricultural Meteorology
|
2+1
|
|
3
|
AGM-504
|
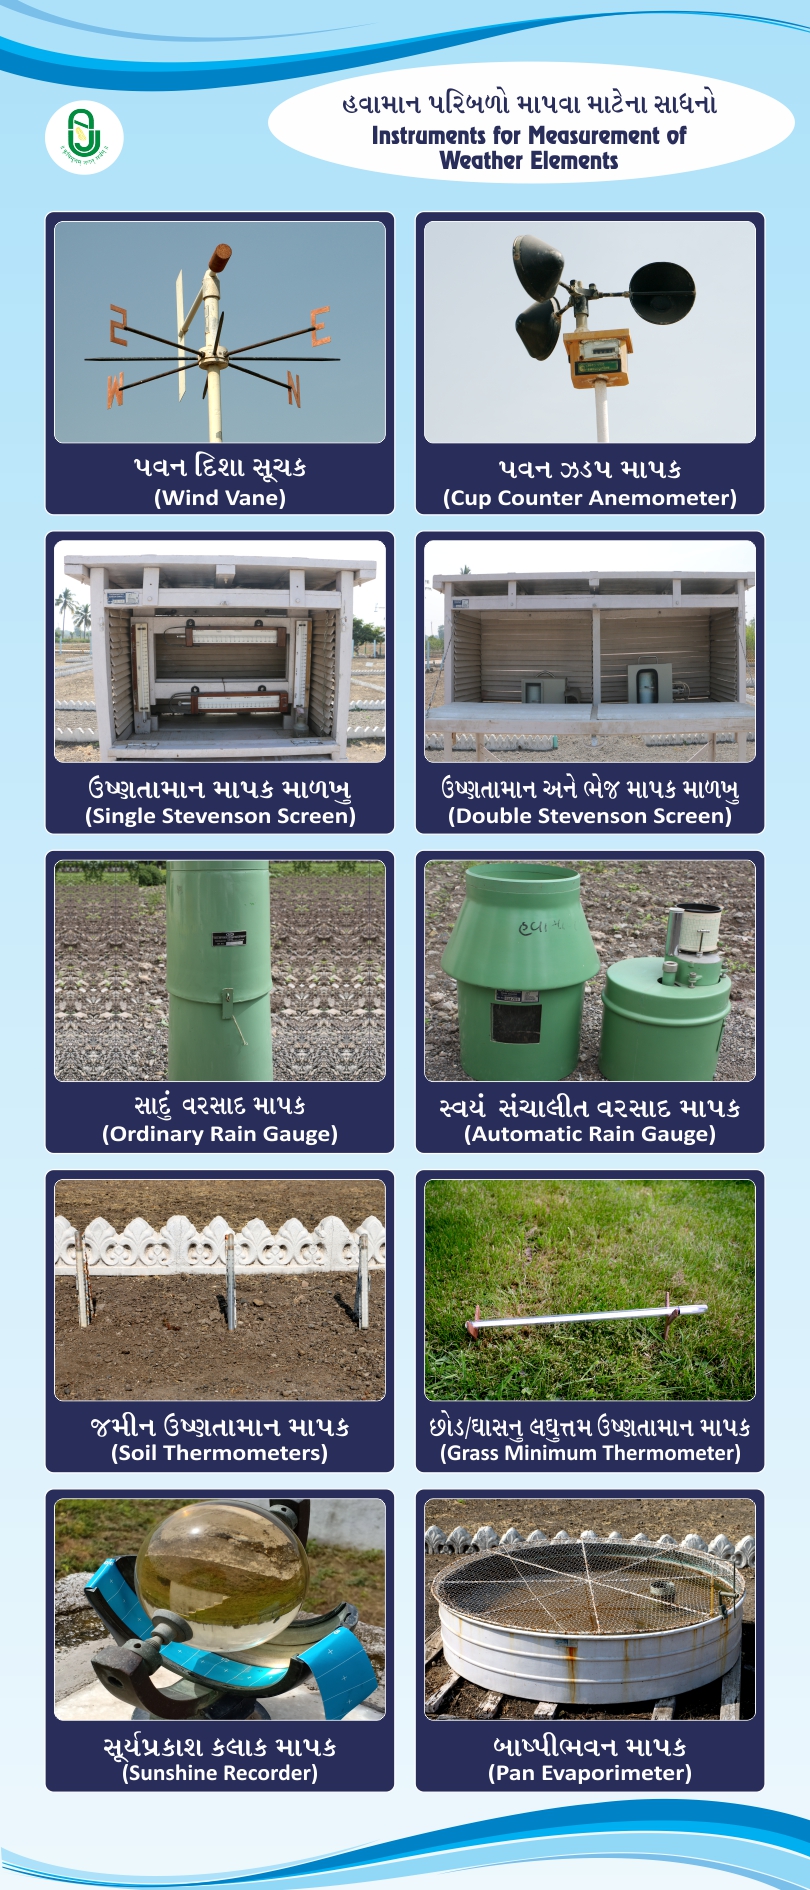
Agro-meteorological Measurements and Instrumentation
|
1+2
|
|
4
|
AGM-505
|
Crop Micrometeorology
|
2+1
|
|
5
|
AGM-507
|
Crop weather models
|
1+2
|
|
6
|
AGM-508
|
Applied Agricultural Climatology
|
1+2
|
|
7
|
AGM-510
|
RS and GIS Applications in Agricultural Meteorology
|
2+1
|
|
8
|
AGM-591
|
Master’s Seminar
|
1+0
|
|
Polytechnic in Horticulture, Junagadh
|
|||
|
1
|
NRM 4.6
|
Agrometeorology and Climate Change
|
1+1
|
Practical Journals Prepared
1. Practical Journal on Remote Sensing
2. Practical Journal on Argil. Meteorology (New and Old UG courses)
P.G. Students in Agricultural Meteorology:|
Sr. No.
|
Name of the student
|
Title of Thesis
|
Major Guide
|
Completion Year
|
|
1
|
Bikram Keshari Patra
J4-05423-2002
|
Assessment of thermal and photo thermal requirements of wheat (Triticum aestivum L.) under South Saurashtra Agro climatic Zone.
|
Dr.D.D.Sahu
|
July-2004
|
|
2
|
M.C.Chopada
04-4706-2000
|
Phenological behavior and yield of Chickpea cultivars under different environments with reference to heat unit concept
|
Dr.D.D.Sahu
|
Sept.-2006
|
|
3
|
Jagarlamudi Suresh Babu
J4-00019-2004
|
Validation of CROPGRO (DSSAT.v.3.5+IC Sim) model for growth, development and yield forecast of rainfed groundnut in South Saurashtra Agro climatic Zone of Gujarat.
|
Dr.D.D.Sahu
|
Sept.-2006
|
|
4
|
Chandoba Prashant Sashikant
J4-00594-2010
|
Crop weather relationship in summer groundnut
|
Dr.D.D.Sahu
|
June-2012
|
|
5
|
Lavand Pramod Sampat Rao
J4-00642-2010
|
Crop weather relationship in summer green gram (Vigna radiate L.)
|
Dr.D.D.Sahu
|
June-2012
|
|
6
|
Vaghasiya Dhimant Rasiklal
J4-00869-2011
|
Impact of Climate Change on Yield and Production of Kharif Groundnut (Arachis hypogaea L.) and Rabi Wheat (Triticum spp.) in Saurashtra Region of Gujarat.
|
Prof.M.C.Chopada
|
Sept.-2014
|
|
7
|
Savaliya Ankur Vinodbhai
2010117122
|
Thermal requirement of garlic (Allium sativa L.) varieties under different environments at Junagadh
|
Prof.M.C.Chopada
|
July-2019
|
|
8
|
Kanjiya Hardik Nileshbhai.
2010118043
|
Calibration and validation of CERES millet (DSSAT 4.6) model for summer pearl millet (Pennisetum glaucum L.) and sensitivity analysis to climate change in South Saurashtra region”
|
Prof.M.C.Chopada
|
Nov.-2020
|
|
9
|
Amethiya Priyanka Manshukhbhai 2010118002
|
Calibration and validation of CROPGRO-Peanut model (DSSAT v.4.6) for summer groundnut and sensitivity analysis to climate change in South Saurashtra region
|
Dr.R.K.Mathukia
|
Nov.-2020
|
|
10
|
Kanjariya Axay Tulashibhai
2010119048
|
Response of wheat (Triticum aestivum L.) to different irrigation schedule based on IW/CPE ratio using CROPWAT model under South Saurashtra region.
|
Prof.M.C.Chopada
|
Sept.-2021
|
|
11
|
Halapara Maheshkumar Navinbhai
2010119035
|
Response of chickpea to different irrigation schedules based on IW:CPE using CROPWAT model under South Saurashtra region
|
Dr.R.K.Mathukia
|
Octo.-2021
|
|
12
|
Dodiya Darshana Pratapbhai
2010120024
|
Phenophasic thermal requirement and yield prediction of summer green gram (Vigna radiata L.) under varying weather conditions
|
Prof.M.C.Chopada
|
Octo.-2022
|
|
13
|
Limbasiya Nikita Dayaljibhai
2010120051
|
Phenophasic thermal requirement and yield prediction of summer black gram (Vigna radiata L.) under varying weather conditions
|
Dr.R.K.Mathukiya
|
Octo.-2022
|
|
14
|
Pruthvi Yadav P
2010116102
|
"Thermal requirement of chickpea (Cicer arietinum L.) under different dates of sowing
|
Dr.R.K.Mathukia
|
July-2023
|
|
S.N.
|
Name of student
|
Regi. No.
|
Category
|
Marks/
Percent obtained
|
Passing year
|
|
1
|
Vaghasiya Dhimant Rasikbhai
|
402075
|
Unreserved
|
90.67
(60.44%)
|
Dec.-2018
|
|
Vaghasiya Dhimant Rasikbhai
|
418462
|
Unreserved
|
81.00
(54.00%)
|
Jan.-2020
|
|
|
2
|
Savaliya Ankur Vinodbhai
|
262519
|
Unreserved
|
84.00
(56.00%)
|
Octo.-2021
|
|
3
|
Kanjariya Axay Tulsibhai
|
243529
|
OBC
|
74.00
(49.33%)
|
Octo.-2021
|
(B) RESEARCH ACTIVITIES /PROJECTS
|
S.N.
|
Name of the Scheme
|
BH
|
Year of start
|
Funding Agency
|
Remarks
|
|
1
|
Integrated Agro met Advisory Services Scheme (Renamed as GKMS)
|
18005-1
|
1995-1996
|
IMD, New Delhi
|
On going
|
|
2
|
Agro meteorological Cell
|
12927
|
1999-2000
|
Govt. of Gujarat
|
On going
|
|
3
|
Energy and Mass Exchange in Vegetative Systems
|
18005-2
|
2008-2009
|
ISRO, SAC, Ahmedabad
|
Completed
2011-12
|
|
4
|
Centre of Excellence for Agro meteorological Services (RKVY)
|
18247-07
|
2008-2009
|
RKVY
|
Completed
2012-13
|
|
5
|
Forecasting of Agricultural out put using Space, Agrometeorology and Land based observations. (FASAL)
|
18005-06
|
2010-2011
|
IMD, New Delhi
|
Completed 2023-24 |
|
Sr. No.
|
Title
|
|
1
|
Verification of medium range weather forecasting
|
|
2
|
Verification of rainfall forecast for different talukas of SSAZ
|
|
3
|
Crop Yield Forecasting through Agro Meteorological Techniques
|
|
4
|
Calibration and validation of CERES model (DSSAT 4.6) for different cultivars of wheat under different sowing time
|
Research Projects:
(1) Project 1:
Gramin Krushi Mausam Sewa (GKMS) at Junagadh.
Objectives:- To verify the validity and accuracy of medium range weather forecast received from IMD, Pune, Super Computer, New Delhi, Met centre, Ahmedabad.
- Preparation of Agro Advisory Bulletins based on medium range weather forecast from IMD, Pune.
- To disseminate the weather based bulletins to farmers through extension net work and mass media, AIR, DD and print media (Local Newspapers).
- Obtain feed back from the farmers on Agro-advisory system.
(2) Project 2:
Establishment of Agro meteorological Cell at Agricultural Colleges
Objectives:- Teaching Agro meteorological courses at under graduate and post-graduate levels.
- Imparting training to students/staff for recording and maintenance of Agro meteorological observatory.
- To conduct research work in various fields of agricultural meteorology.
a. Agro climatic characterization of different regions of state
b. Micrometeorological studies including energy, mass and momentum transfer within and above crop canopy.
c. Development of crop growth models for major crops of the regionRECOMMENDATIONS: Eight
|
Symbol
|
Description
|
GW 499
|
GW 451
|
GJW 463
|
|
PHINT
|
Phyllochron interval (0days)
|
73.4
|
71.2
|
72.8
|
|
P1V
|
Vernalization coefficient
|
0.5
|
0.4
|
0.5
|
|
P1D
|
Photoperiodism coefficient
|
1.80
|
1.90
|
2.00
|
|
P5
|
Grain filling duration coefficient
|
3.25
|
3.15
|
3.10
|
|
G1
|
Kernel number coefficient
|
5.55
|
5.60
|
5.50
|
|
G2
|
Kernel weight coefficient
|
4.20
|
4.35
|
4.25
|
|
G3
|
Spike number coefficient
|
5.25
|
5.35
|
5.30
|
(C) EXTENSION ACTIVITIES
1) The farmers training programmesconducted under RKVY Project:|
S.N.
|
Training Date/Place
|
Taluka
|
No. of farmers benefited
|
|
1
|
11th to 13th January, 2010, Junagadh
|
Junagadh and Vanthali
|
32
|
|
2
|
17th to 19th February, 2010 Junagadh
|
Manavadar and Keshod
|
26
|
|
3
|
26th February, 2010, KVK, Jamanagar
|
Jamanagar and Lalapur
|
28
|
|
4
|
8th to 10th March, 2010 Junagadh
|
Visavadar and Bhesan
|
25
|
|
5
|
25th July, 2011, Junagadh
|
Staff training
|
27
|
|
6
|
3rd November, 2011, Junagadh
|
Staff Meeting and Training
|
14
|
|
7
|
10th January, 2012, KVK, Nanakandhasar
|
Chotila and Sayala Taluka
|
31
|
|
8
|
18th January, 2012, KVK, Targhadia
|
Rajkot and Wankaner Taluka
|
45
|
|
9
|
2nd January, 2012 KVK, Amreli
|
Amreli and Lathi taluka
|
34
|
|
10
|
29th March, 2012 MSRS Kodinar
|
Kodinar and Talala taluka
|
35
|
|
S.N.
|
Training Date/Place
|
Taluka
|
No. of farmers benefited
|
|
1
|
17th March, 2012 Junagadh
|
Junagadh, Bhesan, Vishavadr, Mendrada, Manavadar, Vanthali taluka
|
68
|
|
2
|
27th March, 2012 KVK, Khapat
|
Porbanadar and Ranavav taluka
|
34
|
|
3
|
23rd January, 2015 Junagadh
|
Junagadh, Bhesan, Vishavadr, Mendrada, Manavadar, Vanthali taluka
|
240
|
|
4
|
10th January, 2017 At : Vadal
|
Tal.& Dist.: Junagadh
|
62
|
|
5
|
7th March, 2017 At.: KVK, Khapat
|
Dist. : Porbandar
|
50
|
|
6
|
18th March, 2017 At. Sundarpura
|
Tal. Sutrapada
Dist. Gir Somanath
|
77
|
|
7
|
7th October, 2017 State AWS Orientation Junagadh
|
JAU Employee
|
18
|
|
8
|
1st November,2018 State AWS Orientation Junagadh
|
JAU Employee
|
12
|
|
9
|
13th January,2021
|
Samadhiyala, Tal.: Mendarda
|
52
|
|
10
|
18th March,2021
|
KVK, Khapat
|
25
|
|
11
|
30th Jnue,2021
|
Dhava Gir, Tal.: Talala
|
41
|
|
12
|
17th March, 2022
|
KVK, Khapat
|
73
|
|
13
|
17th March, 2023
|
KVK, Khapat
|
40
|
|
14
|
18th March, 2023
|
At: Bhatiya, Tal. Vanthali,
Dist.: Junagadh
|
60
|
|
Sr. No.
|
Title of lecture
|
Place
|
Date
|
Beneficiaries
|
|
1.
|
Save Ozone Save the Planet
|
CoA, Porbandar
|
14 September, 2022
|
230
|
|
2.
|
Save Ozone Save the Planet
|
CoA, Junagadh
|
16 September, 2022
|
156
|
|
3.
|
Impact of Climate Change
|
CoA, Junagadh
|
5 June, 2022
|
120
|
|
4.
|
Abohava Parivartan ane Weather Based forecasting
|
KVK, Khapat
|
17 March, 2023
|
40
|
|
5.
|
Abohava Parivartan ane Weather Based forecasting
|
Village: Bhatiya
Dist: Junagadh
|
18 March, 2023
|
60
|
|
6.
|
Biodiversity including climate change
|
SSK, JAU, Junagadh
|
19 June, 2023
|
35
|
|
7.
|
Abohava Parivartan ane Weather Based forcasting
|
Village: Bagadu
Dist: Junagadh
|
29 August, 2023
|
25
|
|
OTHER EXTENSION ACTIVITIES
|
|
|
1.
|
Lectures in T & V scheme and KVK training programmes
|
|
2.
|
Lectures in Agro Input Dealers Certificate Course/SSK/ATIC
|
|
3.
|
Prepared meteorological charts on climate change for agril. Fair, university cetral museum & exhibition
|
|
4.
|
Personal and telephonic advice to farmers/dealers about weather forecasting
|
|
5.
|
Celebration of World Ozone Day/ World Environment Day at CoA, JAU., Junagadh
|
|
6.
|
Celebration of World Ozone Day/ World Environment Day at CoA, JAU., Porbandar
|
|
7.
|
Organized Special Lecture on “Climate Change”
|
ON LINE TRAINING PROGRAMME CORDINATED BY AGROMET CELL, DEPARTMENT OF AGRONOMY, JAU, JUNAGADH COLLABORATION WITH IIRS (INDIAN INSTITUTE OF REMOTE SENSING), DEPARTMENT OF SPACE, GOVERNMENT OF INDIA, DEHRADUN
|
S.N
|
Name of programme
|
Period
|
No. of participant
|
Remarks
|
|
1
|
36 IIRS Outreach Programme on Basics of Remote Sensing, Geographical Information System and Global Navigation Satellite System
|
4th September to 26th November, 2018
|
1
|
Completed
|
|
2
|
59 IIRS Outreach Programme on Overview of Planetary Geosciences with special emphasis to the Moon and Mars
|
8th to 12th June, 2020
|
1
|
Completed
|
|
3
|
60 IIRS Outreach Programme on Application of Geoinformatics in Ecological
Studies
|
13rd to 24th July, 2020
|
17
|
Completed
|
|
4
|
61 IIRS Outreach Programme on Satellite Photogrammetry and its Application
|
29th June to 3rd July, 2020
|
6
|
Completed
|
|
5
|
62 IIRS Outreach Programme on Geospatial Inputs for Enabling Master Plan Formulation
|
13th to 24th July, 2020
|
4
|
Completed
|
|
6
|
63 IIRS Outreach Programme on Remote Sensing Applications in Agricultural Water Management
|
3rd to 7th August, 2020
|
5
|
Completed
|
|
7
|
64 IIRS Outreach Programme on Basics of Remote Sensing, Geographical Information System and Global Navigation Satellite System
|
17th August to 20th November, 2020
|
2
|
Completed
|
|
8
|
65 IIRS Outreach Programme on Remote Sensing on Digital Image Analysis
|
17th August to 11th September, 2020
|
1
|
Completed
|
PUBLICATIONS
Books published:|
S.N.
|
Title
|
Author
|
Published by
|
ISBN
|
|
1
|
Remote Sensing Techniques in Agriculture
|
D.D.Sahu and R.M.Solanki
|
AGROBIOS (India), Jodhpur, 2008. pp. 240.
|
81-7754-348-2
|
|
2
|
Practical Agrometeorology
|
D.D,Sahu, M.C Chopada and H.L Kacha
|
AGROBIOS (India), Jodhpur, 2011. pp. 245.
|
9788177544381
|
|
3
|
Fundamentals of Agricultural Climatology
|
D.D,Sahu, H.R.Patel and M.C Chopada
|
AGROBIOS (India), Jodhpur, 2012. pp. 422.
|
978-81-7754-437-4
|
|
4
|
Agrometeorology At a Glance
|
D.D,Sahu, M.C Chopada and H.R.Patel
|
AGROBIOS (India), Jodhpur, 2013. pp. 170.
|
978-81-7754-624-1
|
|
5
|
Efficacy of herbicides and bioassay in summer pearl millet (E-Book)
|
V.B.Bhalu,
S.K.Chhodavadiya and M.C.Chopada
|
Lambert Academy Publishing, OmniScriptum GmbH & Co.KG. BahnhafstraBe 28,66111 Saarbruckea, Germany pp.1-149
|
978-3-659-93663-0
|
|
6
|
Droughts and The Way Forward
(Book Chapter No.-6)
|
Col.(Dr.) A.R.Pathak,.
R.K.Mathukia and M.C.Chopada
|
Kamdhenu University, Karmayogi Bhavan, Block-I, Wing-B-I, 4th Floor, Sector10A, Gandhinagar- 382010 pp. 86-104.
|
978-93-5267-836-5
|
|
S.N.
|
Title
|
|
|
1
|
Vedhshala na Sadhano ni Samaj
(Folder)
|
 |
|
2
|
Hawaman Aagahi ane Krushima Tenu Mahatva
(Folder)
|
 |
|
3
|
Krushi Hawaman Avalokan Margdarshika
(Booklet)
|
 |
|
4
|
Havaman Paribalo ane Pak Utpadan
(Booklet)
|
 |
|
5
|
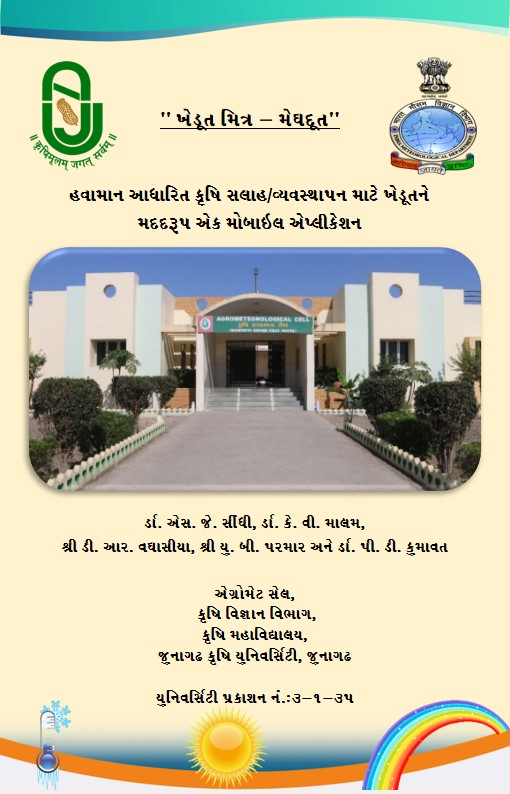
Khedut Mitra-Meghdoot
Havaman adharit krushi salah/vyavasthapan mate khedut ne madadrup ek mobile application
(Folder)
|
 |
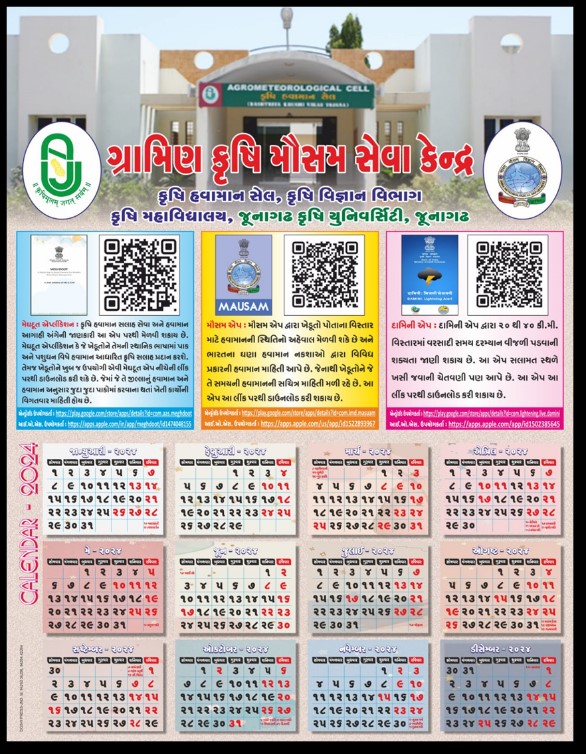
| 6 | Weather Based Mobile Application Calendar-2024 |
 |
APPENDIX-I
|
1
|
Sahu, D.D., Asodaria K.B. and Patoliya, B.M. (2000): A Guide for recording Agrometeorological observations. Agromet Research. Bulletin No.-1
|
|
2
|
Sahu, D.D. and Patoliya, B.M. (2001). Rainfall Climatology of Junagadh region. Agromet Research Bulletin No.-2
|
|
3
|
Sahu, D.D., Patoliya, B.M. and Parmar, B.V.: Annual Weather at Junagadh during 2000. Agromet Research Bulletin No.-3
|
|
4
|
Sahu, D.D., Patoliya, B.M. and Parmar, B.V.: Distribution of weather Parameters at Junagadh 2001. Agromet Research Bulletin No.-4
|
|
5
|
Sahu, D.D. and Patoliya, B.M. (2002). Rainfall distribution climatology of Junagadh district. Agromet Research Bulletin No.-5
|
|
6
|
Sahu, D.D., Patoliya, B.M. and Parmar, B.V.: Distribution of weather Parameters at Junagadh 2002, Agromet Research Bulletin No.-6
|
|
7
|
Sahu, D.D., Patoliya, B.M. and Parmar, B.V.: Distribution of weather Parameters at Junagadh 2003, Agromet Research Bulletin No.-7
|
|
8
|
Sahu, D.D., Patoliya, B.M. and Parmar, B.V.: Annual Weather at Junagadh during 2004. Agromet Research Bulletin No.-8
|
|
9
|
Sahu, D.D., Patoliya, B.M., Khanpara, V.D. and Parmar, B.V.: Annual Weather at Junagadh during 2005. Agromet Research Bulletin No.-9
|
|
10
|
Sahu, D.D., Rathod, D.N., Khanpara, V.D. and Parmar, B.V.: Annual Weather at Junagadh during 2006. Agromet Research Bulletin No.-10
|
|
11
|
Sahu, D.D., Khanpara, V.D., Rathod, D.N. and Parmar, B.V.: Annual Weather at Junagadh during 2007. Agromet Research Bulletin No.-11
|
|
12
|
Sahu D.D., Khanpara, V.D., Rathod, D.N. and Parmar B.V.: Annual Weather at Junagadh during 2008. Agromet Research Bulletin No.-12
|
|
13
|
Sahu D.D., Chopada, M.C. Khanpara, V.D., and Parmar B.V.: Annual Weather at Junagadh during 2009. Agromet Research Bulletin No.-13
|
|
14
|
Sahu D.D., Chopada, M.C., Khanpara, V.D and Parmar B.V.: Annual Weather at Junagadh during 2010. Agromet Research Bulletin No.-20
|
|
15
|
Sahu D.D., Chopada, M.C., Khanpara, V.D and Parmar B.V.: Annual Weather at Junagadh during 2011. Agromet Research Bulletin No.:-21
|
|
16
|
Sahu D.D., Chopada, M.C., Khanpara, V.D and Parmar B.V.: Annual Weather at Junagadh during 2012. Agromet Research Bulletin No.-22
|
|
17
|
Chopada, M.C., Sagaraka B.K. and Parmar B.V.: Annual Weather at Junagadh during 2013. Agromet Research Bulletin No.-23
|
|
18
|
Chopada, M.C., Sagaraka B.K. and Parmar B.V.: Annual Weather at Junagadh during 2014. Agromet Research Bulletin No.-24
|
|
19
|
Chopada, M.C., Sagaraka B.K. and Parmar B.V.: Annual Weather at Junagadh during 2015. Agromet Research Bulletin No.-25
|
|
20
|
Chopada, M.C., Sagaraka B.K. and Parmar B.V.: Annual Weather at Junagadh during 2016. Agromet Research Bulletin No.-26
|
|
21
|
Chopada, M.C., Sagaraka B.K. and Parmar B.V.: Annual Weather at Junagadh during 2017. Agromet Research Bulletin No.-27
|
|
22
|
Chopada, M.C., Sagaraka B.K. and Parmar B.V.: Annual Weather at Junagadh during 2018. Agromet Research Bulletin No.-28
|
|
23
|
Chopada, M.C., Sagaraka B.K. and Parmar B.V.: Annual Weather at Junagadh during 2019. Agromet Research Bulletin No.-29
|
|
24
|
Chopada, M.C., Mathukia R.K. and Parmar B.V. Vaghasiya D.R.,Parmar U.B. and Malam K.V.: Annual Weather at Junagadh during 2020. Agromet Research Bulletin No.-30
|
|
25
|
Chopada, M.C., Mathukia R.K. and Parmar B.V. Vaghasiya D.R., Parmar U.B. and Malam K.V.: Annual Weather at Junagadh during 2021. Agromet Research Bulletin No.-31
|
|
26
|
Sindhi, S. J., Chopada, M.C., Kumavat, P.D., Vaghasiya, D. R., Parmar, B.V., Malam, K.V., and Parmar, U. B., Annual Weather at Junagadh during 2022. Agromet Research Bulletin No.-32
|
| 27 | Sindhi, S. J., Kumavat, P.D., Chovatia, P.K., Parmar, B.V., Vaghasiya, D. R., Parmar, U. B., and Malam, K.V., Annual Weather at Junagadh during 2023. Agromet Research Bulletin No.-33 |
| 28 | Sindhi, S. J., Chovatia, P.K., Parmar, B.V., Vaghasiya, D. R., and Parmar, U. B., Annual Weather at Junagadh during 2024. Agromet Research Bulletin No.-34 |
APPENDIX-II
|
1
|
Sahu, D. D. and Patel, R. R. (1985). Probability study of rainfall for Banaskantha district, North Gujarat Region.GAU Res. J. 10(2): 27-33
|
|
2
|
Sahu, D. D. (1992). Agro climatic assessment of water requirement of Kharif Crops in Gujarat State in relation to phenology. GAU Res. J. 18(1): 141
|
|
3
|
Sahu, D. D. and Sastry, P. S. N. (1992). Influence of Phenophasic rainfall and water requirement on yield of rice crop in Gujarat State. Orissa J. Agri. Res. 5(2): 6-9.
|
|
4
|
Sahu, D.D.and Sastry, P. S. N. (1992). Water Availability Pattern and Water Requirement of Kharif Crops in Saurashtra Region, Gujarat.Annals of Arid Zone. 31(2): 127-133.
|
|
5
|
Sahu, D. D. and Sastry, P. S. N. (1992). Crop water deficit index at phenophases and yield of Kharif crops in Gujarat. Annals of Arid Zone. 31(4): 277-280.
|
|
6
|
Sahu, D. D. and Sastry, P. S. N. (1993). Phenophasic and Seasonal water requirement of major Kharif crops in different Agro climatic zones of Gujarat State. GAU Res. J. 18(2): 28-34.
|
|
7
|
Sahu, D. D. and Sastry, P. S. N. (1993). An assessment of methods of estimating reference crop evapotranspiration (ETo) in Gujarat region GAU Res. J. 18(2): 105-108.
|
|
8
|
Sahu, D. D., Sastry, P. S. N. and Dixit, S. K. (1994). Growing season and productivity in rain fed groundnut. J. Oilseeds Res. 11(2): 152-159.
|
|
9
|
Sahu, D. D., Pandya, H. R. and Dixit, S. K. (1994). Annual and Seasonal effects of meteorological and associated parameters on Pan Evaporation. GAU Res. J. 19(2): 82-86.
|
|
10
|
Sahu, D. D., Sastry, P. S. N., Dixit, S. K. and Pandya, H. R. (1994). Predication of pearl millet yield using crop water balance model for different agro climatic zones of Gujarat State. Annals of Arid Zone. 33(3): 219-222.
|
|
11
|
Sersiya, R. A., Butani, P. G. and Sahu, D. D. (1998). Population build up of groundnut leaf hopper in relation to weather parameters. J. Oilseeds Res. 15(1): 156-159.
|
|
12
|
Dudhatra, M.G., Patoliya, B.M., Sahu, D.D. and Patel, M.M. (2001). Production potential and economics of different cropping systems in SSAZ. National symposium on farming systems Research in New Millennium held at Modipuram. Pp. 15-17.
|
|
13
|
Dudhatra, M.G., Patoliya, B.M. and Sahu, D.D., (2001). Productivity and economics of Legume-Cereal/ Cereal-Legume cropping systems against Cereal-Cereal cropping systems. J. Farming Systems Research and development. 7(1): 105-106.
|
|
14
|
Sahu, D. D., Patoliya, B.M. and Asodaria, K. B. (2002). Studies on rainfall pattern and groundnut productivity in Junagadh region Journal of Agro meteorology. 2:2, pp. 140-146.
|
|
15
|
Subbaiah, R. and Sahu, D. D. (2002). Weekly rainfall model for real time irrigation management. Journal of Agro meteorology. 4(1): 65-73.
|
|
16
|
Sahu, D.D., Patra, B.K. and Patolia, B.M. (2004). Effect of sowing time and rainfall distribution on groundnut yield. International Arachis new letter no. 24. pp. 39-42.
|
|
17
|
Parmar, B.A., Sahu, D.D., Dixit, S.K. and Patolia, B.M. (2004). Forcasting of groundnut yield using rainfall variables for Saurashtra region of Gujarat State. J. of Agrometeorology. 6(1): 111-114.
|
|
18
|
Sahu, D.D., Golakiya, B.A. and Patolia, B.M. (2004). Impact of rainfall on the yield of rainfed groundnut. J. of Agrometeorology.6(1): 249-253.
|
|
19
|
Sahu, D.D. and Patolia, B.M. (2005). Assessment of efficient groundnut cropping zone in Gujarat. International Arachis news letter no. 25. pp. 48-51.
|
|
20
|
Sahu, D.D., Chopada, M.C. and Patolia, B.M. (2006). Determination of sowing time for chick pea varieties in South Saurashtra Agro-climatic Zone. J. of Agrometeorology. 9(1): 68-73.
|
|
21
|
Patra, B.K. and Sahu, D.D. (2006). Use of Agrometeorological indices for suitable sowing time of wheat under South Saurashtra agro climatic zone of Gujarat. J. of Agrometeorology. 9(1): 74-80.
|
|
22
|
Sahu, D.D. (2008). Annual and seasonal variability of climate in South Saurashtra Agro Climatic Zone. J. of Agrometeorology. 10(1): 93-96.
|
|
23
|
Sahu, D.D. (2008). Characteristics of weekly rainfall pattern at Junagadh in Saurashtra region. J. of Agrometeorology. 10(2): 221-223.
|
|
24
|
Sahu, D.D., Chopada, M.C., Kacha, H.L. and Solanki, S.M. (2009). Climatic variability and its impact on crop productivity in South Saurashtra Agro Climatic Zone. Abstracts and Souvenir, 4th National seminar, Agrometeorology-Needs, Approaches and Linkages for Rural Development held at CCS, HAU, Hisar. 26-27- Nov., 2009.pp.36.
|
|
25
|
Sahu, D.D., Solanki, R.M. and Chopada, M.C., (2010). Determination of sowing time for rain fed groundnut using heat unit concept underSouth Saurashtra climatic zone,In: Agro meteorological services for farmers. Ed. Vyas Pandey AAU, Anand. pp. 98-105.
|
|
26
|
Sahu, D.D., Chopada, M.C. and Kacha H.L.,(2010). Trends in rainfall and temperature distribution over Saurashtra region,In: Extended Summaries Vol. I. National Symposium on climate change and rainfed Agriculture, CRIDA, Hyderabad, pp. 40-46.
|
|
27
|
Sahu, D.D., Chopada, M.C. and Kach, H.L. (2011).Verification of medium range rainfall forecast under South Saurashtra Agroclimatic Zone, Gujarat. J. of Agrometeorology. 13 (1): 65-67.
|
|
28
|
Patel H.P, Savaliya S.G. and Chopada M.C. (2012). Soil site suitability evaluation for soybean in meghal irrigation command area of Southern Saurashtra region of Gujarat. An Asian Journal of Soil Science. 7(1):117-123.
|
|
29
|
Patel H.P, Savaliya S.G. and Chopada M.C. (2012). Evaluation of soil constraints and soil site suitability evaluation for groundnut in different land forms of meghal irrigation command area of Southern Saurashtra region of Gujarat. An Asian Journal of Soil Science. 7(1):131-137
|
|
30
|
Jat Ram, Chopada, M.C. and Mathukia R.K. (2015). Climate Change and Variability, and Farmers Response in Saurashtra Region of Gujarat,India. Poster Presentation International Arid Cereals Conference,The international conference on “Transitioning Cereal Systems to Adapt to Climate Change” organized by REACH (Regional Approaches to Climate Change for North-West Pacific Agriculture) at Minneapolis-St. Paul, Minnesota, USA during Nov. 13-14, 2015.
|
|
31
|
Patel, D.V., Chopada, M.C., Kanani, P.R. and Parakhia, A.M. (2016). Empirical Evaluation and Validation of Rainfall Prediction based on ITKs by different predictors in Saurashtra Region. National Seminar SEEG-2016 on “Contemporary Innovations for Quantum Extension in Agricultural Development” Held during March 18-19, 2016 at JAU, Junagadh.
|
|
32
|
Chopada, M.C., Chhodavadia, S.K. (2016) Trends and variability in evapotranspiration at Junagadh,Gujarat.Innovare Innovare Journal of Agricultural Science.4(4) :1-5.
|
|
33
|
B Ramani B.B, Patel, D.V. and Chopada M.C. (2016). Regression Analysis of rainfall, maximum temperature and bright sunshine in relation to yield of groundnut for Junagadh district in climate change context, Abstact poster presented in the international conference on FOOD, WATER, ENERGY nexus in arena of Climate change (14-16 October, 2016).pp.225.
|
|
34
|
Chopada, M.C., Chhodavadia, S.K. (2016). Assessment of accuracy of medium range weather forecast at Junagadh. Poster presented in the international conference on FOOD, WATER, ENERGY nexus in arena of Climate change (14-October, 2016).pp.244.
|
|
35
|
Chhodavadia, S.K., Chopada, M.C.and Bhalu,V.B. (2016) Influence of temporal changes in climate variabilities on crop production in South-North Saurashtra zones of Gujarat,India. Innovare Journal of Agricultural Science. 4(4):1-4.
|
|
36
|
Vaghasiya, D.R., Chopada, M.C. B.S. Gohil and H.N. Der (2016) The influence of weather variability on yield and production of wheat (Triticum spp.) Crop in junagadh District of Gujarat state under climate change. International Journal of Science, Environment and Technology, Vol. 5(5), 2896 – 2906
|
|
37
|
Chopada, M.C., Chhodavadia, S.K. and Vora,V.D. (2016). Influence of Thermal Time Requirement and Heat Use Efficiency in Yield Related Parameters in Chickpea Crop in Gujarat.Agricultural Science,Vol.(5),308-310.
|
|
38
|
B.K. Sagarka*, M.A. Shekh, R.K. Mathukia and M.C. Chopada (2017). Fine-tuning of sowing time and spacing for summer guar (Cyamopsis tetragonoloba) under climate change scenario. Poster presented in the international conference on FOOD, WATER, ENERGY nexus in arena of Climate change (14-16 October, 2016).pp.244.
|
|
39
|
Chopada, M.C. and Vaghasiya, D.R. (2017) The relationship between weather parameters and yield of kharif groundnut crop in Jamnagar district of Gujarat state under climate.Abstract published in The National Seminar on Agrometeorology for Sustainable Development with special emphasis on Agrometeorological Practices for Climate Resilient Farming and Food Security (12-14 October,2017 at CCS,HAU,Hissar),pp.8.
|
|
40
|
Chopada, M.C. and Vaghasiya, D.R. (2017). Long term rainfall analysis over Saurashtra and Kutchh regions of Gujarat. Abstract published in The National Seminar on Agrometeorology for Sustainable Development with special emphasis on Agrometeorological Practices for Climate Resilient Farming and Food Security (12-14 October,2017 at CCS, HAU, Hissar),pp.100.
|
|
41
|
Vora, V.D. and Chopada, M.C. (2018) Thermal requirement of kharif crops under rainfed condition in north Saurashtra of Gujarat. Journal of Pharmacognosy and Phytochemistry. 7(1): 666-670.
|
|
42
|
R. K. Mathukia, M. A. Shekh, M. C. Chopada and B. K. Sagarka(2018) Appraisal of optimal sowing time based on heat indices and row spacing for summer guar [Cyamopsis tetragonoloba (L.) Taub.].Fmg. & Mngmt. 3(1): 47-51.
|
|
43
|
Vaghasiya D.R. and Chopada M.C. (2018) Development of statistical model for pre-harvest yield Prediction of kharif groundnut in Jamnagar district of Gujarat State. Agric Res J. 55(3): 472-477.
|
|
44
|
Kanjiya, H.N., Chopada, M.C., Vaghasiya, D.R. and Savaliya A.V. (2021). Effect of Planting Dates on Growth and Yield of Pearl Millet (Pennisetum glaucum L.). Int. J. Curr. Microbiol. App. Sci., 10(1): 287-291.
|
|
45
|
Kanjiya, H.N., Chopada, M.C., Kotadiya, P.B. and Kanjariya, A.T. (2021). Effect of thermal indices on yield of pearl millet (Pennisetum glaucum L.) varieties under variable weather conditions of south Saurashtra Agro-climatic zone of Gujarat. Int. Advances in Bioresearch, 12(5): 279-286.
|
|
46
|
Kanjiya, H.N. and Chopada, M.C. (2021). Calibrate and validate CERES-MILLET model under variant environmental condition for different cultivars of summer pearl millet in south Saurashtra region. The Journal of Phytopharmacology. 10(3):211-214.
|
APPENDIX-III
|
1.
|
Training in Agro meteorological observations from 5/6/78 to 5/7/78 (for one month). Agricultural Meteorology Division, IMD Pune.
|
|
2.
|
Summer institute on Agro-forestry in Arid and Semi-arid zone from 15th June to 14th July, 1981 (for one month).CAZRI, Jodhpur.
|
|
3.
|
Winter school on Environmental Ecology from 20/10/85 to 10/11/85 (for 21 days). B. N. College, Udaipur, Rajasthan.
|
|
4.
|
Winter School on “Remote Sensing in Agriculture with special emphasis on Watershed development from Dec. 5-30, 1994 (for 25 days). Division of Agricultural Physics, IARI, New Delhi.
|
|
5.
|
A short course on Agrometeorological models for use in developing agro-advisories, held at PAU, Ludhiana from 1-10, October, 1999.
|
|
6.
|
Winter school on Remote sensing with special emphasis precision Farming, held at IARI, Division Agril. Physics, New Delhi, from 17th March to 10th April, 2003.
|
|
7.
|
Systems Approach for Climate Risk Management in Agriculture held at TNAU, Centre for Soil and Crop Management Studies, Coimbatore from 30 Aug. to 8 Sept.-2004.
|
APPENDIX-IV
APPENDIX-V
|
S.N.
|
Reporting Year
|
Place
|
Period
|
|
1
|
1995-96
|
Indira Gandhi Agril. Uni., Chhatisgadh
|
14-15,May-1996
|
|
2
|
1996-97
|
GAU, Anand
|
15-16 May, 1997
|
|
3
|
1997-98
|
TNAU, Coimbatore
|
13-15 May, 1998
|
|
4
|
1998-99
|
PAU, Ludhiana
|
6-8, Spet.-1999
|
|
5
|
1999-00
|
OUAT, Orissa
|
19-20, September, 2000
|
|
6
|
2000-01
|
NDUAT, Faizabad
|
Sept.,14-18, 2001
|
|
7
|
2001-02
|
KAU, Trissur
|
28-30, Nov, 2002
|
|
8
|
2002-03
|
-
|
-
|
|
9
|
2003-04
|
-
|
-
|
|
10
|
2004-05
|
AAU,Jorhat, Assam
|
30 Nov. to 2 Dec.- 2005
|
|
11
|
2005-06
|
GBPUAT, Panthnagar
|
04-06 Jan., 2006
|
|
12
|
2006-07
|
AAU, Anand
|
04-06 Dec.-2007
|
|
13
|
2007-08
|
CAZRI, Jodhpur
|
10-12 Nov.-2008
|
|
14
|
2008-09
|
IIT, Roorkee
|
10-12 Dec. 2009
|
|
15
|
2009-10
|
ANGRU,Hyderabad
|
20-22 Dec.-2010
|
|
16
|
2010-11
|
Limbucherra,Agartala
|
18-20 Dec.-2011
|
|
17
|
2011-12
|
BHU,Varansi
|
21-23 Nov.-2012
|
|
18
|
2012-13
|
MPAUT, Udaipur
|
20-22 Nov.-2013
|
|
19
|
2013-14
|
BAU,Kanke,Ranchi
|
12-13 Nov.-2014
|
|
20
|
2014-15
|
UAS,Dharwad
|
23-26 Nov.-2015
|
|
21
|
2015-16
|
OUAT, Bhubaneswar. (Odisha)
|
14-17 Dec.2016
|
|
22
|
2016-17
|
IGKV,Raipur
|
15-18 Nov. 2017
|
|
23
|
2017-18
|
Regional Agricultural Research Station (RARSI, Tirupati (AP)
|
3-6 Dec.-2018
|
|
24
|
2018-19
|
RVSKVV, Gwalior
|
18 to 20 Dec.2019
|
|
25
|
2019-20
|
On line review meeting
TNAU, Coimbatore
|
3 to 4 Dec.,2020
|
|
26
|
2020-21
|
On line review meeting
IMD, New Delhi
|
18/11/2021
|
|
27
|
2021-22
|
On line review meeting
IMD, New Delhi
|
15/11/2022
|
APPENDIX-VI
|
1.
|
Patoliya, B.M., Sahu, D.D. and Dudhatra, M.G. (1999). Hawaman Purvanuman Ane Krushi Salah. (Weather forecasting and agroadvisory): Krushigovidhya, June-1999, Narmada Kishan Parivar Patra, July-1999, Krushi Jivan, June-1999, Kishan Samuh, July-August-1999.
|
|
2.
|
Patoliya, B.M., Sahu, D.D. and Dudhatra, M.G. (2000). Krushi ane Hawaman (Agriculture and Weather) : Agro-tech.
|
|
3.
|
Patoliya, B.M. and Sahu, D.D. (2000). Krushi Ayojana ma Mausom Purvanuman nu Mahatwa (Importance of weather forecasting in Agriculture planning): Krushigovidhya.
|
|
4.
|
Sahu, D.D. and Patoliya, B.M. (2000). Vadala Ane Hawaman Agahi (Cloud and Weather Forecasting): Krushigovidhya.
|
|
5.
|
Chopda, M.C., Malam, K.V., Parmar, U.B. and Vaghasiya, D.R. (2020). Krushi Havaman Bulletin tatha Khedut Upyogi Mobile Application ne Jano. (Agriculture Weather Bulletin and Farmers Related Mobile Applications) Krushi Prabhat Newspaper.
|
|
6.
|
Sindhi, S. J., Malam K.V., Vaghasiya D. R., Parmar U. B, Kumawat, P. D. and Gohil, P.J.: 2023. Khedut Mitra-Meghdoot:- Havaman adharit krushi salah mate khedutne madadroop ek mobile application. Krushi Jivan, 659(2): 24-26.
|
|
1.
|
D.D. Sahu (2009). Introduction to weather and climate. AGROBIOS News Letter. Vol. VII, April, 2009. pp.-58
|
|
2.
|
D.D. Sahu and M.C. Chopada (2009). No cloud no rain, know cloud know rain. AGROBIOSNews Letter. Vol. VIII, Sept., 2009. pp.-61.
|
|
3.
|
D.D. Sahu, M.C. Chopada and R.M. Solanki (2009). Influence of rainfall on Agricultural operations and crops. AGROBIOSNews Letter. Vol. IX, Oct., 2009. pp.-41.
|
|
4.
|
D.D. Sahu, M.C. Chopada and H.L. Kacha (2009). The science and philosophy of remote sensing. AGROBIOSNews Letter. Vol.VIII, December, 2009. pp.-31.
|
|
5.
|
D.D. Sahu and M.C. Chopada (2010). Folklores on prediction of monsoon and crop yields AGROBIOSNews Letter. Vol.IX (4) September, 2010. pp.-26.
|
|
6.
|
D.D. Sahu, M.C. Chopada, N.N.Galani and H.L. Kacha (2011). Cloud is the brain of rain. AGROBIOSNews Letter. Vol.IX (10) March, 2011. pp.-41.
|
|
7.
|
D.D. Sahu, R.K.Mathukia and M.C. Chopada (2012). Physiological Consequences of Global Warming. AGROBIOSNews Letter. Vol.XI (06) Nov., 2012. pp.-27.
|
|
8.
|
D.D. Sahu and M.C. Chopada (2012). Theories on Causes of Climate Change. AGROBIOSNews Letter. Vol.XI (07) Dec., 2012. pp.-34-35.
|
|
9.
|
D.D. Sahu and M.C. Chopada and S.P. Tank (2013).Theories behind Climate Change. AGROBIOSNews Letter. Vol.XI (11) April, 2013. pp.-20-21.
|
|
10.
|
D.D. Sahu and M.C. Chopada and S.P. Tank (2013). Global Warming and Climate Change. AGROBIOSNews Letter. Vol.XI (11) April, 2013. pp.-21-22.
|
DETAILS OF EXTENSION ACTIVITIES
-
Lectures in T & V scheme and KVK training programmes
-
Lectures in Agro Input Dealers Certificate Course
-
Lectures in different radio talks programmes
-
Prepared meteorological charts on climate change for agril. Fair, university central museum & exhibition
-
Personal and telephonic advice to farmers/dealers about weather forecasting
-
Prepared the weather forecasting twice in a week
|
Sr.
No.
|
Name
|
Date
(DD/MM/YY)
|
Name of invited organization
|
Title of lecture/talk
|
|
1.
|
Celebration of World Ozone Day
|
16/09/2022
|
NAU, Navsari
|
"Save Ozone Save the Planet"
|
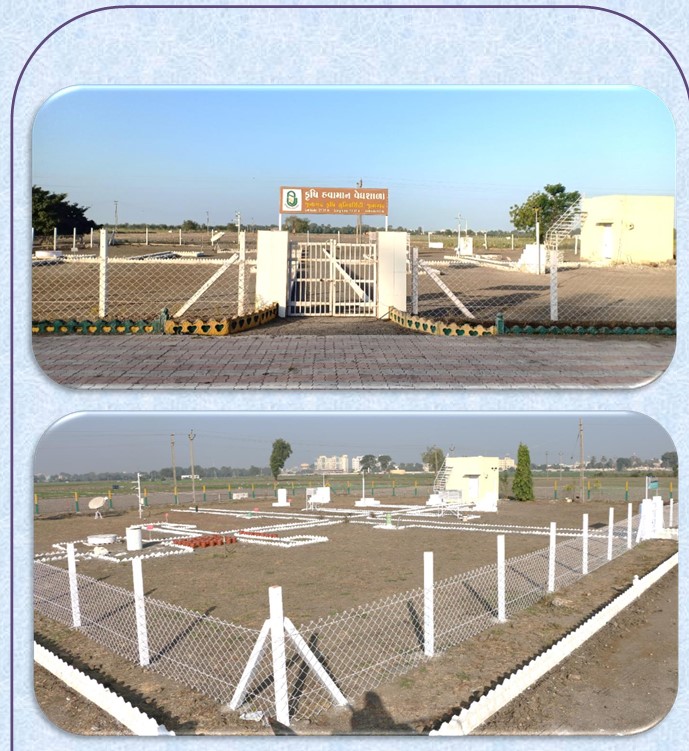
Facilities at Agro- Met Cell
 |
|
|
Meteorological Observatory
|
|
 |
 |
|
Agro- Met Museum
|
|
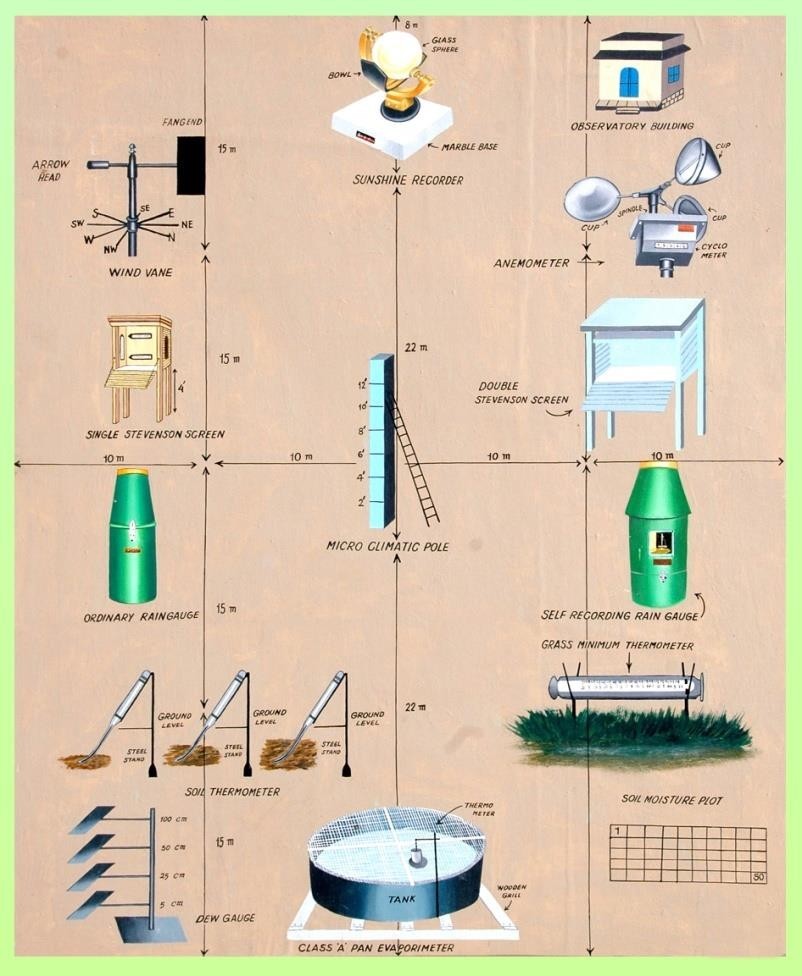
LAY OUT OF METEREOLOGICAL OBSERVATORY
|
Contact Details:-
|
||||
|
1.
|
i. Name & Address of Unit.
|
:
|
Agro meteorological Cell,
Department of Agronomy,
Junagadh Agricultural University
Junagadh-362 001. (Gujarat)
|
|
|
|
ii. Agro climatic zone
|
:
|
South Saurashtra Agro climatic Zone
|
|
|
|
iii. Districts
|
:
|
Junagadh, Gir-Somnath and Porbandar
|
|
|
2.
|
Head of the Department
|
:
|
Dr. P. K. Chovatia
Professor and Head,
Department of Agronomy,
Junagadh Agricultural University
Junagadh-362 001. (Gujarat)
Fax/Phone : 0285-2670139 (O)
E-mail : This email address is being protected from spambots. You need JavaScript enabled to view it.
|
|
|
3.
|
Nodal officer
|
:
|
E-mail:- This email address is being protected from spambots. You need JavaScript enabled to view it.
|
|